
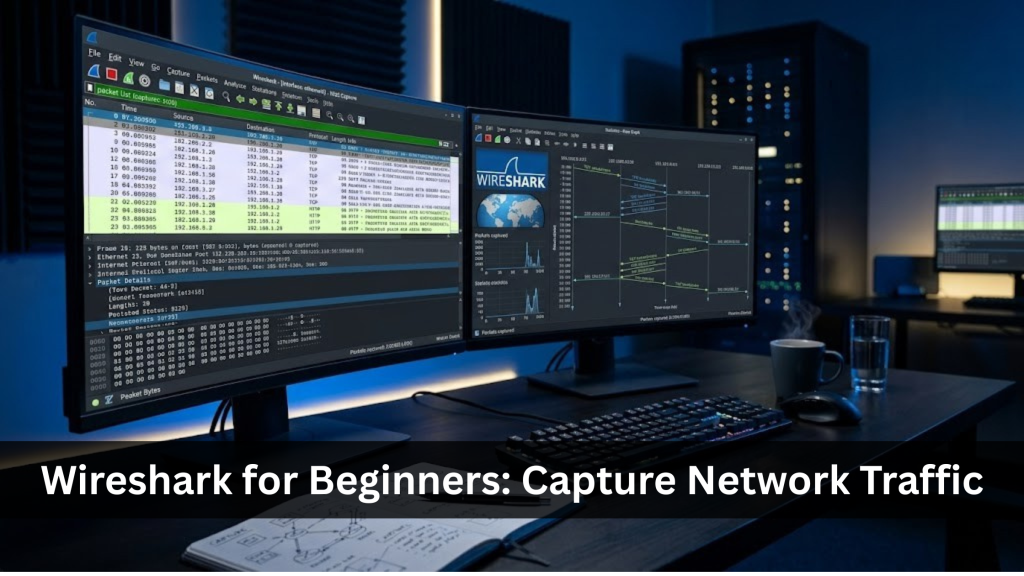
Introduction
Network communication powers almost everything we do online. Every website you visit, every email you send, every video you stream, and every file you download relies on thousands—or even millions—of tiny pieces of data travelling across networks.
Most people never see this hidden layer of the internet.
Cybersecurity professionals, network engineers, system administrators, and privacy researchers do.
One of the most powerful tools for understanding what happens beneath the surface is Wireshark.
Whether you’re troubleshooting a slow network, learning cybersecurity, managing a homelab, or simply curious about how data moves between devices, Wireshark allows you to observe network communication in remarkable detail.
The ability to inspect network traffic is more than a technical skill—it is an exercise in understanding the systems that shape your digital life.
That aligns directly with the philosophy of Digital Sovereignty.
Understanding technology reduces dependence on guesswork, strengthens your ability to diagnose problems, and helps you make informed decisions about privacy, security, and infrastructure.
In this guide, you’ll learn how to install Wireshark, capture network packets, interpret common protocols, and analyse traffic safely within an ethical and educational context.

MEN OF LETTERS
Get the Modern Sovereignty
Framework PDF and join a
community committed to
digital freedom and self-reliance.
Begin Your Sovereignty Protocol
Most people use technology they do not understand.Digital Sovereignty is more than cybersecurity. It is the ability to understand the systems that shape your digital life and consciously take control of them.
- Digital Sovereignty Fundamentals
- Privacy & Security Principles
- AI & Modern Systems
- The Four Pillars of Sovereignty
Start your journey with the free PDF.
What Is Wireshark?
Wireshark is a free and open-source network protocol analyzer used to capture and inspect data packets travelling across a network.
Think of it as a microscope for network communication.
Instead of looking at files stored on your computer, Wireshark allows you to observe information as it moves between devices in real time.
Every time your computer communicates with another device, it exchanges packets containing information such as:
- IP addresses
- Domain names
- Protocol information
- Timing data
- Connection details
- Network errors
- Routing information
By examining these packets, you can understand exactly how devices communicate and identify issues that would otherwise remain hidden.
Wireshark supports thousands of protocols, making it one of the most versatile tools available for:
- Cybersecurity education
- Network troubleshooting
- Performance analysis
- Protocol learning
- Malware investigation in controlled environments
- Digital forensics
- Homelab experimentation
Unlike vulnerability scanners or penetration testing tools, Wireshark does not attack or exploit systems. Its primary purpose is observation and analysis, making it an essential utility for anyone who wants to understand networks rather than simply use them.
Why Network Traffic Analysis Matters
Every application depends on network communication.
When something goes wrong—whether a website loads slowly, a DNS lookup fails, or a secure connection cannot be established—the root cause often lies within the network traffic itself.
Packet analysis provides visibility into these interactions.
Understanding network traffic enables you to:
- Diagnose connectivity problems
- Identify DNS resolution failures
- Detect excessive latency
- Understand application behavior
- Verify encrypted connections
- Learn how internet protocols operate
- Validate firewall rules
- Troubleshoot self-hosted services
- Improve network performance
- Build foundational cybersecurity skills
From a Digital Sovereignty perspective, network analysis transforms technology from a black box into a transparent system. Instead of relying solely on applications to tell you what is happening, you gain the ability to inspect the underlying communication directly.
This deeper understanding supports better decisions about privacy, security, and infrastructure management.
How Wireshark Works
Wireshark captures packets that pass through a selected network interface, such as an Ethernet adapter or a Wi-Fi connection.
Each packet contains metadata and payload information that Wireshark decodes into a human-readable format.
At a high level, the process consists of four stages:
- Packet Capture – Wireshark records packets transmitted through the chosen interface.
- Protocol Decoding – It interprets packet contents using built-in protocol dissectors.
- Filtering – You isolate specific traffic using capture or display filters.
- Analysis – You inspect conversations, identify anomalies, troubleshoot issues, or study protocol behavior.
Rather than modifying network traffic, Wireshark operates passively. It observes communications without altering them, making it suitable for diagnostics, learning, and defensive analysis in authorized environments.
Requirements
Before you begin, ensure you have:
- A Windows, Linux, or macOS system
- Administrative privileges for installation
- An internet connection
- Basic understanding of networking concepts (helpful but not required)
- Permission to capture traffic on the network you are analysing
For practice, it is recommended to use:
- Your own home network
- A virtual lab environment
- A self-hosted service
- A local virtual machine
- A cybersecurity lab such as Metasploitable or DVWA running in an isolated environment
Avoid capturing traffic on networks that you do not own or administer without explicit authorization.
Installing Wireshark
Wireshark supports all major desktop operating systems.
The installation process is straightforward, but there are a few platform-specific considerations that improve the experience.
In the next section, you’ll learn how to install Wireshark on Windows, Linux, and macOS, along with the packet capture drivers required for monitoring network interfaces.
Configuring Wireshark
Proper configuration ensures accurate packet capture while reducing unnecessary noise during analysis.
In the next section, you’ll learn how to:
- Select the correct network interface
- Enable promiscuous mode when appropriate
- Understand monitor mode on wireless adapters
- Configure capture options
- Create your first packet capture
- Apply basic display filters
- Navigate the Wireshark interface efficiently
These foundational skills will prepare you for practical packet analysis and real-world troubleshooting scenarios in the hands-on tutorial that follows.
Step-by-Step Tutorial
Now that Wireshark is installed and configured, it’s time to begin capturing and analysing network traffic.
Don’t worry if you’ve never used a packet analyser before. This section starts with the fundamentals and gradually introduces more advanced concepts.
By the end, you’ll know how to:
- Capture live network traffic
- Navigate the Wireshark interface
- Read packets
- Filter large captures
- Analyse common protocols
- Follow conversations between devices
- Export packet captures
- Build a repeatable workflow for troubleshooting
Understanding the Wireshark Interface
When you launch Wireshark, you’ll see several key areas.
Understanding these sections will make packet analysis much easier.
1. Welcome Screen
The welcome screen lists all available network interfaces, including:
- Ethernet adapters
- Wi-Fi adapters
- Virtual machine interfaces
- VPN adapters
- Loopback interfaces
Interfaces with active traffic display a moving graph, helping you identify which connection is currently in use.
Tip: If you’re browsing the web over Wi-Fi, select your wireless adapter rather than an inactive Ethernet interface.
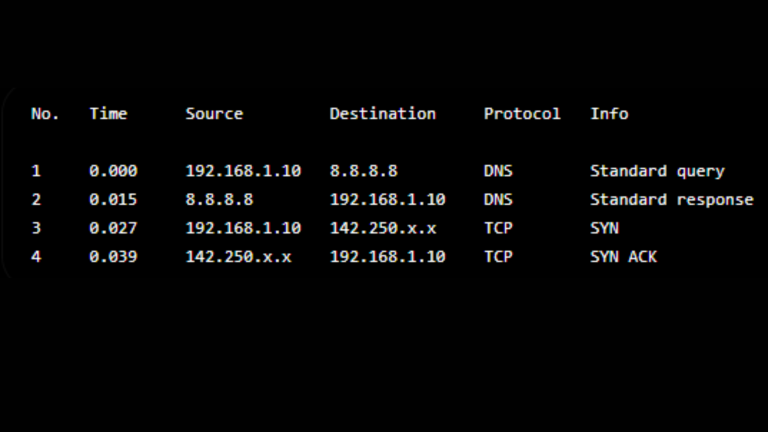
2. Packet List Pane
This is the top pane where every captured packet appears as a separate row.
Each row includes information such as:
- Packet number
- Timestamp
- Source IP address
- Destination IP address
- Protocol
- Packet length
- Brief description
No. Time Source Destination Protocol Info
Example:
3. Packet Details Pane
Selecting a packet reveals a structured breakdown of its contents.
Typical layers include:
Frame

Ethernet II

Internet Protocol (IPv4)

Transmission Control Protocol (TCP)

Hypertext Transfer Protocol (HTTP)
Each layer can be expanded to inspect fields such as:
- MAC addresses
- IP addresses
- TCP flags
- Port numbers
- Sequence numbers
- Protocol options
4. Packet Bytes Pane
The bottom pane displays the packet in hexadecimal and ASCII.
Although beginners rarely need it initially, this view becomes useful when learning:
- Binary protocols
- Malware analysis
- Digital forensics
- Protocol reverse engineering
Your First Packet Capture
Let’s capture some real traffic.
Step 1
Launch Wireshark.
Step 2
Choose the active network interface.
Usually:
- Wi-Fi
- Ethernet
Double-click the interface.
Packet capture begins immediately.
Step 3
Open a browser.
Visit several websites.
For example:
Return to Wireshark.
You’ll now see hundreds—or even thousands—of packets.
Don’t panic.
This is normal.
Modern operating systems constantly communicate across the network.
Step 4
Click the red Stop button.
Your capture is now frozen for analysis.
Understanding a Packet
Click any packet.
Notice several important fields.
Source
The sender.
Example:
192.168.1.15
Destination
The receiver.
Example:
142.250.190.46
Protocol
Examples include:
- TCP
- UDP
- DNS
- HTTP
- HTTPS (TLS)
- ICMP
- ARP
Length
Packet size in bytes.
Example:
74 Bytes
Info
A concise summary.
Examples:
</p>
SYN

ACK

Client Hello

DNS Query

HTTP GET
Understanding the TCP Three-Way Handshake
Nearly every TCP connection begins with the same process.
Client
|
SYN
|
Server
|
SYN ACK
|
Client
|
ACK
This handshake establishes a reliable connection before any application data is exchanged.
In Wireshark, you can often identify these packets immediately before an HTTP request or TLS handshake.
Recognizing this sequence is one of the first milestones in learning packet analysis.
Display Filters
One capture can easily contain tens of thousands of packets.
Display filters allow you to isolate the traffic that matters.
Show only DNS traffic
dns
Show only TCP
tcp
Show only UDP
udp
Show only HTTP
http
Show only HTTPS (TLS)
tls
Show ICMP (Ping)
icmp
Show traffic to a specific IP
ip.addr == 192.168.1.15
Show traffic from an IP
ip.src == 192.168.1.15
Show traffic to an IP
ip.dst == 8.8.8.8
Show packets on port 443
tcp.port == 443
Show packets on port 80
tcp.port == 80
Show DNS queries only
dns.flags.response == 0
Show DNS responses only
dns.flags.response == 1
Capture Filters vs Display Filters
A common mistake is confusing capture filters with display filters.
| Capture Filters | Display Filters |
|---|---|
| Applied before capture | Applied after capture |
| Reduce recorded traffic | Hide or show packets already captured |
| Improve performance | Improve analysis |
| Cannot recover discarded packets | Never deletes packets |
Example capture filter:
host 192.168.1.20
Example display filter:
ip.addr == 192.168.1.20
Use capture filters when you know exactly what you want to record. Use display filters when you want flexibility during analysis.
Following a TCP Stream
One of Wireshark’s most useful features is reconstructing an entire conversation between two endpoints.
Example
- Select an HTTP packet.
- Right-click it.
- Choose:
Follow
↓
TCP Stream
Wireshark reconstructs the complete exchange between the client and the server.
This is extremely useful for:
- Learning application protocols
- Debugging web applications
- Understanding API requests
- Inspecting plaintext protocols in lab environments
Note: Modern websites typically use HTTPS. Wireshark can still show the TLS handshake and metadata, but the encrypted application content cannot be read without the appropriate session keys.
Analysing DNS Requests
Every time you visit a website, your computer first resolves the domain name into an IP address.
Filter:
dns
Example sequence:
Client
↓
Query
example.com
↓
DNS Server
↓
Response
93.184.216.34
Useful fields include:
- Query name
- Response code
- Time to respond
- Returned IP addresses
- Record type (A, AAAA, MX, TXT, etc.)
DNS analysis is invaluable when diagnosing slow websites or name resolution failures.
Analysing HTTP Traffic
For educational purposes, you can inspect unencrypted HTTP traffic in a controlled lab.
Filter:
http
You may observe requests such as:
GET /index.html HTTP/1.1</p>
Host: example.com

User-Agent: Firefox
From these packets, you can learn how browsers communicate with servers using methods like:
- GET
- POST
- PUT
- DELETE
In modern production environments, most traffic uses HTTPS, so the application data is encrypted.
Understanding HTTPS and TLS
When visiting secure websites, filter for:
tls
Although the payload is encrypted, Wireshark still reveals useful metadata, including:
- TLS version
- Cipher suite negotiation
- Server Name Indication (SNI), where applicable
- Certificate exchange
- Handshake timing
- Session establishment
This information is often sufficient to troubleshoot connectivity or certificate issues without decrypting traffic.
TCP Retransmissions
Retransmissions often indicate network problems.
Useful filter:
tcp.analysis.retransmission
Common causes include:
- High latency
- Congestion
- Packet loss
- Faulty network hardware
- Wireless interference
Frequent retransmissions are a strong indicator that further investigation is needed.
Inspecting ICMP (Ping)
Filter:
icmp
Example exchange:
Echo Request
↓
Echo Reply
ICMP analysis helps diagnose:
- Connectivity
- Packet loss
- Response times
- Routing issues
Conversations and Endpoints
Navigate to:
Statistics
↓
Conversations
This view summarizes communication between hosts, showing:
- Source and destination
- Total packets
- Bytes transferred
- Conversation duration
Similarly, the Endpoints view provides an overview of every device observed during the capture, making it easy to identify the most active hosts.
Exporting Captures
Saving captures allows you to revisit them later or share them with teammates during troubleshooting.
To save a capture:
File
↓
Save As
Wireshark stores captures in the .pcapng format by default.
You can also export specific packets or filtered results if you only need a subset of the traffic.
Privacy note: Packet captures may contain sensitive metadata. Before sharing a capture, review it carefully and remove or anonymize information that should not leave your environment.
At this point, you’ve learned how to capture traffic, navigate the interface, apply filters, inspect common protocols, follow conversations, and save your work. In Part 3, you’ll apply these skills to ethical real-world scenarios, learn troubleshooting techniques, avoid common mistakes, and finish with security best practices and FAQs.
Real-World Ethical Use Cases
Wireshark is widely used by network engineers, cybersecurity professionals, system administrators, educators, and researchers. Although it is a powerful tool, its primary purpose is observation—not exploitation.
Always capture traffic only on networks you own, administer, or have explicit permission to analyse.
1. Troubleshooting Slow Networks
One of Wireshark’s most common uses is diagnosing network performance issues.
For example, imagine a self-hosted website takes several seconds to load. Using Wireshark, you can determine whether the delay is caused by:
- Slow DNS resolution
- TCP retransmissions
- Packet loss
- High latency
- Excessive TLS handshake time
- Server response delays
Rather than guessing, packet analysis provides measurable evidence of where communication is slowing down.
2. Learning Network Protocols
Reading about TCP, UDP, DNS, and HTTP is valuable, but seeing these protocols in action makes the concepts far easier to understand.
With Wireshark, you can observe:
- DNS queries and responses
- TCP three-way handshakes
- HTTPS/TLS negotiations
- ARP requests
- ICMP echo requests and replies
- DHCP address assignments
Watching these protocols in real time helps build intuition about how networks function.
3. Diagnosing DNS Problems
If a website fails to load, the issue may not be the web server itself. DNS resolution problems are a common cause of connectivity failures.
Wireshark allows you to inspect:
- DNS query names
- Response codes
- Response times
- Returned IP addresses
- Failed lookups (NXDOMAIN)
- Timeouts
This visibility makes it easier to determine whether the problem lies with the DNS server, the client, or the network path.
4. Verifying Firewall Rules
After configuring a firewall, it’s useful to confirm that traffic is being allowed or blocked as intended.
Wireshark can help verify:
- Whether packets reach the destination
- Whether responses are returned
- Which ports are in use
- Whether connections are reset or dropped
This approach complements firewall logs by showing what actually traverses the network.
5. Analysing Self-Hosted Services
If you run services such as:
- Nextcloud
- Home Assistant
- Jellyfin
- Pi-hole
- Nginx
- Reverse proxies
Wireshark can help troubleshoot:
- Failed client connections
- Certificate issues
- Redirect loops
- Unexpected retransmissions
- Slow application responses
- Service discovery problems
For Digital Sovereignty advocates operating home labs, packet analysis is an invaluable diagnostic skill.
6. Cybersecurity Education
Many cybersecurity courses include Wireshark because understanding network traffic is fundamental to defensive security.
Students often use it to:
- Study malware behaviour within isolated labs
- Observe protocol interactions
- Analyse packet captures from security exercises
- Understand attack techniques from a defensive perspective
- Practise incident response using recorded traffic
Learning to interpret packet captures strengthens analytical thinking and prepares students for more advanced security topics.
Common Mistakes
Beginners frequently encounter similar challenges when first using Wireshark. Understanding these pitfalls can save significant time.
Capturing the Wrong Interface
If no packets appear, you may have selected an inactive network interface.
Always choose the interface showing active traffic, such as your Wi-Fi or Ethernet adapter.
Forgetting to Stop the Capture
Continuous captures quickly generate very large files.
Stop the capture once you have collected the necessary traffic to keep analysis manageable.
Confusing Capture Filters and Display Filters
Capture filters determine which packets are recorded.
Display filters determine which recorded packets are shown.
Applying the wrong type of filter can result in missing important traffic or recording far more data than necessary.
Ignoring Time Synchronization
When analysing communications between multiple devices, incorrect system clocks can make event correlation difficult.
Ensure devices have synchronized time, preferably using NTP.
Assuming Encryption Can Be Bypassed
HTTPS encrypts application data. Wireshark can display handshake information and metadata, but encrypted payloads remain unreadable without appropriate decryption keys.
Do not expect to view the contents of modern encrypted web sessions.
Capturing on Public Networks
Avoid analysing traffic on public or third-party networks without explicit authorization.
Even passive packet capture may violate organizational policies or applicable laws.
Troubleshooting
No Packets Are Appearing
Possible causes include:
- Incorrect interface selected
- No active network traffic
- Missing packet capture driver
- Insufficient privileges
- VPN or virtual adapter confusion
Generate traffic by opening a website or running a ping while capturing.
Wireshark Cannot Capture Packets
On Windows, verify that the packet capture driver installed correctly during setup.
On Linux, ensure your user has permission to capture packets or run Wireshark with the appropriate capabilities.
Too Much Traffic
Modern operating systems generate constant background communication.
Use display filters such as:
dns
tcp
ip.addr == 192.168.1.15
Filtering helps isolate the traffic relevant to your investigation.
Packet Names Look Confusing
Protocol names may seem overwhelming at first.
Focus on learning the most common ones:
- ARP
- ICMP
- TCP
- UDP
- DNS
- HTTP
- TLS
Mastering these protocols provides a solid foundation before exploring more specialized traffic.
Large Capture Files
Long captures can consume significant disk space.
Consider:
- Shorter capture sessions
- Capture filters
- Saving only relevant packets
- Compressing archived captures
Best Practices
Developing good habits early makes packet analysis more effective.
Capture Only What You Need
Targeted captures are easier to analyse than recordings containing millions of unrelated packets.
Label Saved Captures
Use descriptive filenames such as:
dns-troubleshooting-home-network.pcapng
or
tls-handshake-lab-01.pcapng
Meaningful names simplify future analysis.
Keep Notes
Record:
- Capture purpose
- Network configuration
- Devices involved
- Date and time
- Observations
- Display filters used
Good documentation is invaluable during troubleshooting and incident response.
Learn Display Filters Gradually
You do not need to memorize every filter.
Start with:
- tcp
- udp
- dns
- tls
- icmp
- ip.addr
- tcp.port
Expand your knowledge as your experience grows.
Practice in a Lab
The safest environment for learning is your own lab.
Examples include:
- Virtual machines
- Home networks
- Docker environments
- Self-hosted services
- Practice platforms such as Metasploitable and DVWA
Controlled environments allow experimentation without affecting production systems.
Security Considerations
Packet captures often contain sensitive information.
Even when application data is encrypted, metadata can reveal valuable insights.
Examples include:
- Internal IP addresses
- Device names
- Domain names
- Network topology
- MAC addresses
- Timing information
- DNS requests
Treat capture files as confidential documents.
Before sharing a capture:
- Remove unnecessary packets
- Verify no sensitive credentials are present
- Anonymize addresses where appropriate
- Store captures securely
- Delete files that are no longer needed
Remember that Wireshark is a passive analysis tool. Ethical use requires permission and respect for privacy.
Frequently Asked Questions
1. Is Wireshark free?
Yes. Wireshark is free and open source under the GNU General Public License.
2. Is Wireshark legal?
Yes, provided you capture traffic only on networks you own or have explicit authorization to analyse.
3. Can Wireshark read HTTPS passwords?
No. HTTPS encrypts application data, preventing Wireshark from displaying passwords or other encrypted content under normal circumstances.
4. Does Wireshark slow down my network?
Generally no. However, capturing very large volumes of traffic may increase CPU, memory, or storage usage on the computer performing the capture.
5. Can Wireshark capture Wi-Fi traffic?
Yes, although capabilities depend on your wireless adapter, operating system, and whether monitor mode is supported.
6. Should beginners learn Wireshark?
Absolutely. It is one of the best tools for understanding how modern networks operate and is widely used in cybersecurity education.
7. What file format does Wireshark use?
The default format is .pcapng, which supports rich metadata and is compatible with many analysis tools.
8. Can Wireshark detect malware?
Not directly. It helps analysts inspect suspicious network behaviour, but it is not an antivirus or malware scanner.
9. Do I need programming knowledge?
No. Basic networking knowledge is helpful, but Wireshark can be learned without programming experience.
10. What should I learn after Wireshark?
A natural progression includes:
- TCP/IP fundamentals
- Nmap
- Burp Suite Community Edition
- Linux networking
- Firewall administration
- Network security monitoring
- Intrusion Detection Systems
- Digital forensics
Conclusion
Every website you visit, every application you use, and every device you connect generates network traffic.
For most people, this communication remains invisible.
Wireshark changes that.
Instead of relying on assumptions, you gain direct visibility into the conversations occurring between devices. You learn how connections are established, how protocols interact, where failures occur, and how modern networks actually function.
This skill extends far beyond cybersecurity.
It improves troubleshooting, strengthens privacy awareness, supports self-hosting, and builds confidence in managing your own technology.
At Men Of Letters, we believe Digital Sovereignty begins with understanding. The more you understand the systems around you, the less dependent you become on guesswork and the more capable you become of making informed decisions.
Wireshark is not merely another cybersecurity tool—it is a window into the hidden infrastructure that powers the digital world.
Master it, and you take another meaningful step toward mastering the systems that shape your digital life.

Start Your Protocol
Small, deliberate steps create massive transformation over time.
Recommended External References
Official Documentation
Wireshark Official Documentation
https://www.wireshark.org/docs
Wireshark User Guide
https://www.wireshark.org/docs/wsug_html_chunked
Wireshark Display Filter Reference
https://www.wireshark.org/docs/dfref
Wireshark GitLab Repository
https://gitlab.com/wireshark/wireshark
Npcap
Cybersecurity References
OWASP
NIST Computer Security Resource Center
MITRE ATT&CK
Linux Foundation Networking Documentation
https://training.linuxfoundation.org
RFC Editor